
JOHNSON & JOHNSON · DATA VISUALIZATION & UI DESIGN
Redesigning a Surgical Risk Score Dashboard
Turning a complex risk model into a score surgeons and their patients can talk through.
ROLE
Sole UX designer
TEAM
Product Manager, Engineering
METHODS & CONTRIBUTIONS
PM-relayed feedback synthesis
Competitive analysis
UI Design
OUTCOME
A simplified direction shipped, which was well received at later surgeons’ meetings
IN SHORT
01
Context
VELYS is a robotic-assisted orthopedic surgical system that assists surgeons during total knee (TKA) and partial knee (UKA) replacements. As part of the pre-operative journey, the platform surfaces an algorithmically derived risk score for a patient’s surgical outcome, meant to support conversations between surgeons and patients before surgery. The underlying model — a logistic regression trained on outcome data — was fixed. My scope was how that output got presented and understood, not the model itself.
02
The Ask
Through the Product Manager’s interactions with physicians, the feedback on the existing Risk Score dashboard was that it was difficult to read and interpret. They also wanted a way to simulate a risk score in order to show a patient how their risk might change if a modifiable factor, like weight or a prescription usage, changed.

03
Access Constraints
I didn’t have direct access to physicians during design iterations. What existed was a small set of PM-relayed reactions gathered informally at a physicians’ conferences. Attendees had eyes on an early version of the design for a few minutes and their comments came back to me secondhand, under significant time pressure.
Alongside brief and informal feedback, I also ran a competitive analysis of other risk calculators, inside and outside of medicine.

04
The Process: Clarifying ambiguity
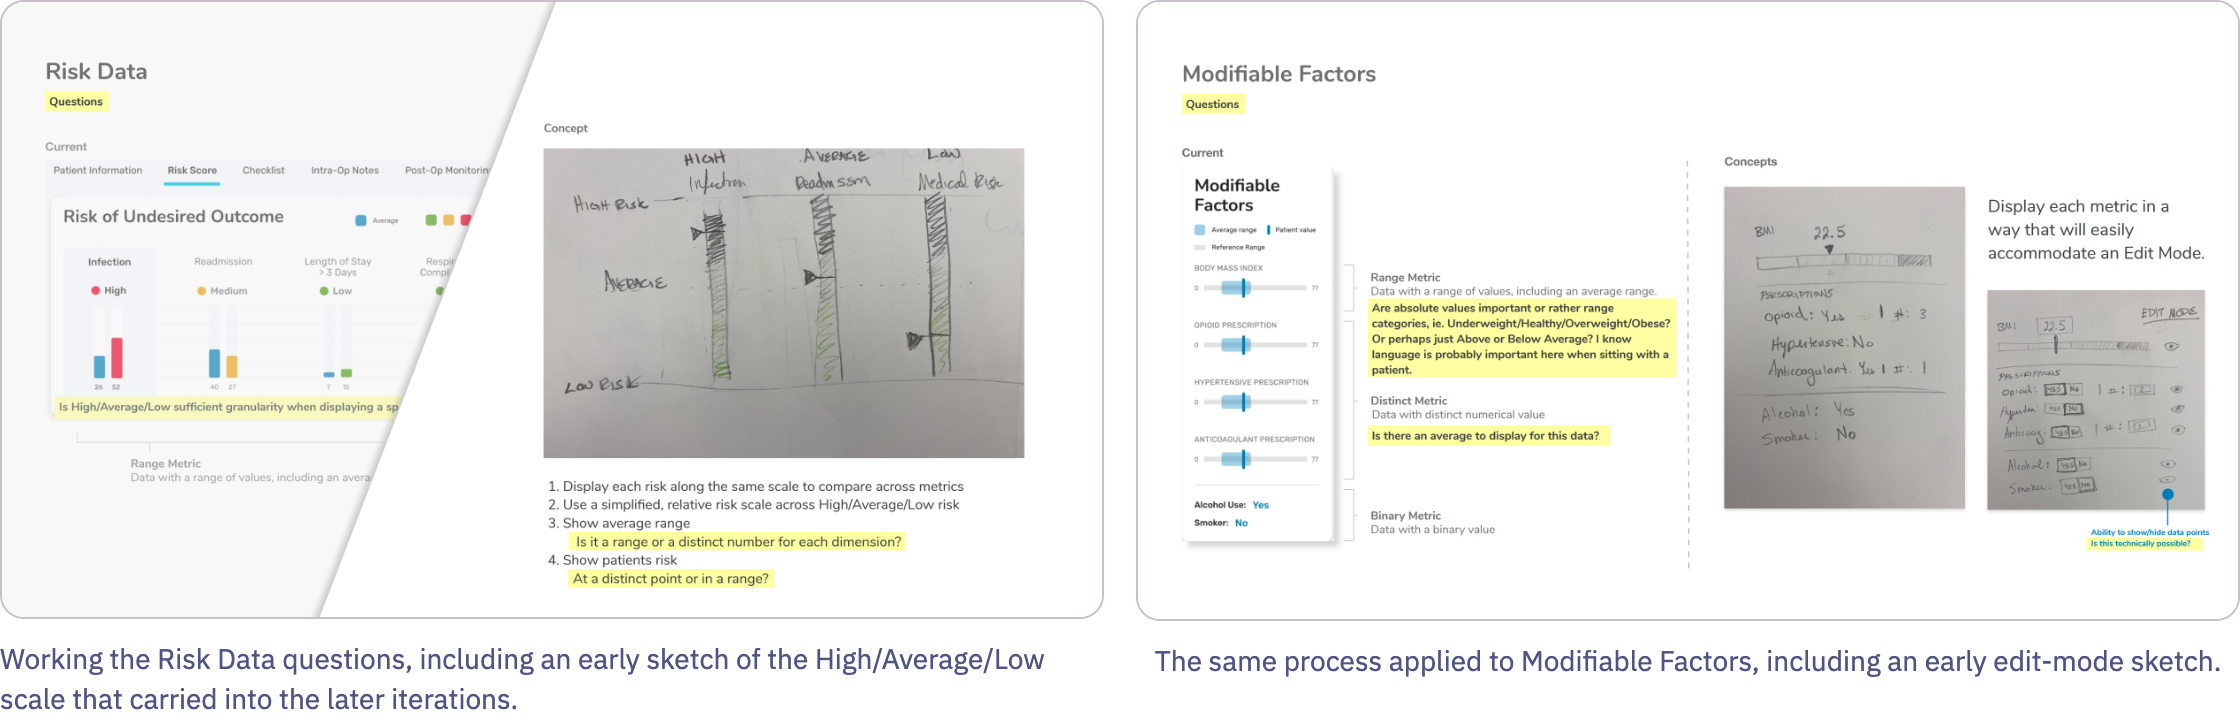
Given how thin the input was, the first useful thing I could do was turn open questions into an explicit, structured list rather than guess at answers — organized by the two data domains in the display: Risk Data (the algorithm’s output) and Modifiable Factors (the inputs a physician could discuss changing with a patient). Questions like “is High/Average/Low sufficient granularity, or do users need range values?” and “Should modifiable factors show absolute values or categories?” became the actual design brief, in the absence of a real one.
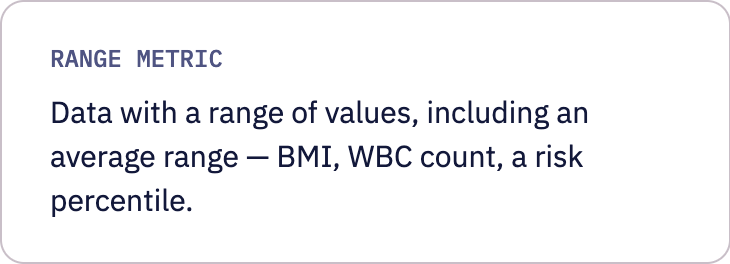
Alongside that, I categorized every data point in the display by its underlying type — before deciding how to visualize any of them. That taxonomy is what actually drove the UI decisions downstream, more than any single piece of feedback did.


05
Exploring Directions
With the open questions named, I explored several ways to show relative risk. I carried three into the presentation; a fourth didn’t hold up and I set it aside.
ITERATION 1
An overall risk score led the view, with each category’s own risk level shown plainly and the comparison-to-average detail held back until a card was expanded.
ITERATION 2
A visually compact, single vertical list of every category at once, each with an inline comparison bar, and influential factors listed in two columns to condense the expanded view.
ITERATION 3
A tabbed view, one category at a time. It was the best use of real estate per category, but limited horizontally. Its comparison bar used one plain color rather than coloring by risk level.
06
Feedback: What Surgeons Said
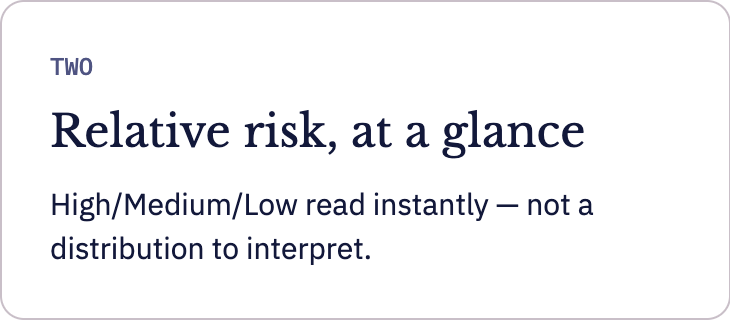
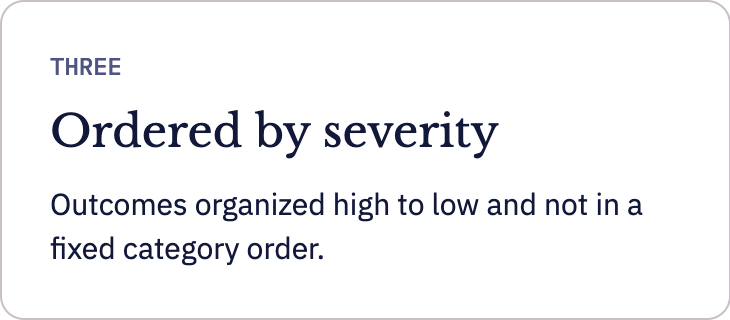
One of these three directions went into a presentation. The PM-relayed reaction to it, again secondhand and brief, gave three clear points.

07
The pivot & what shipped
My first pass used box-and-whisker plots to show a patient's risk relative to a cohort distribution. I soon realized via relayed feedback that this level of statistical granularity was not preferred or needed by physicians. To them, what the sum total of the statistics meant within the context of the risk calculator was their bottom line.
What physicians wanted was the bottom line and not the statistics behind it.
I pivoted to a simplified relative scale of High/Medium/Low against an average marker. The actual need was fast comprehension in a time-constrained patient conversation, not distributional accuracy. Taking the surgeon's feedback together (individual factors over one overall score, H/M/L at a glance, ordered by severity), I began a further redesign along those lines.
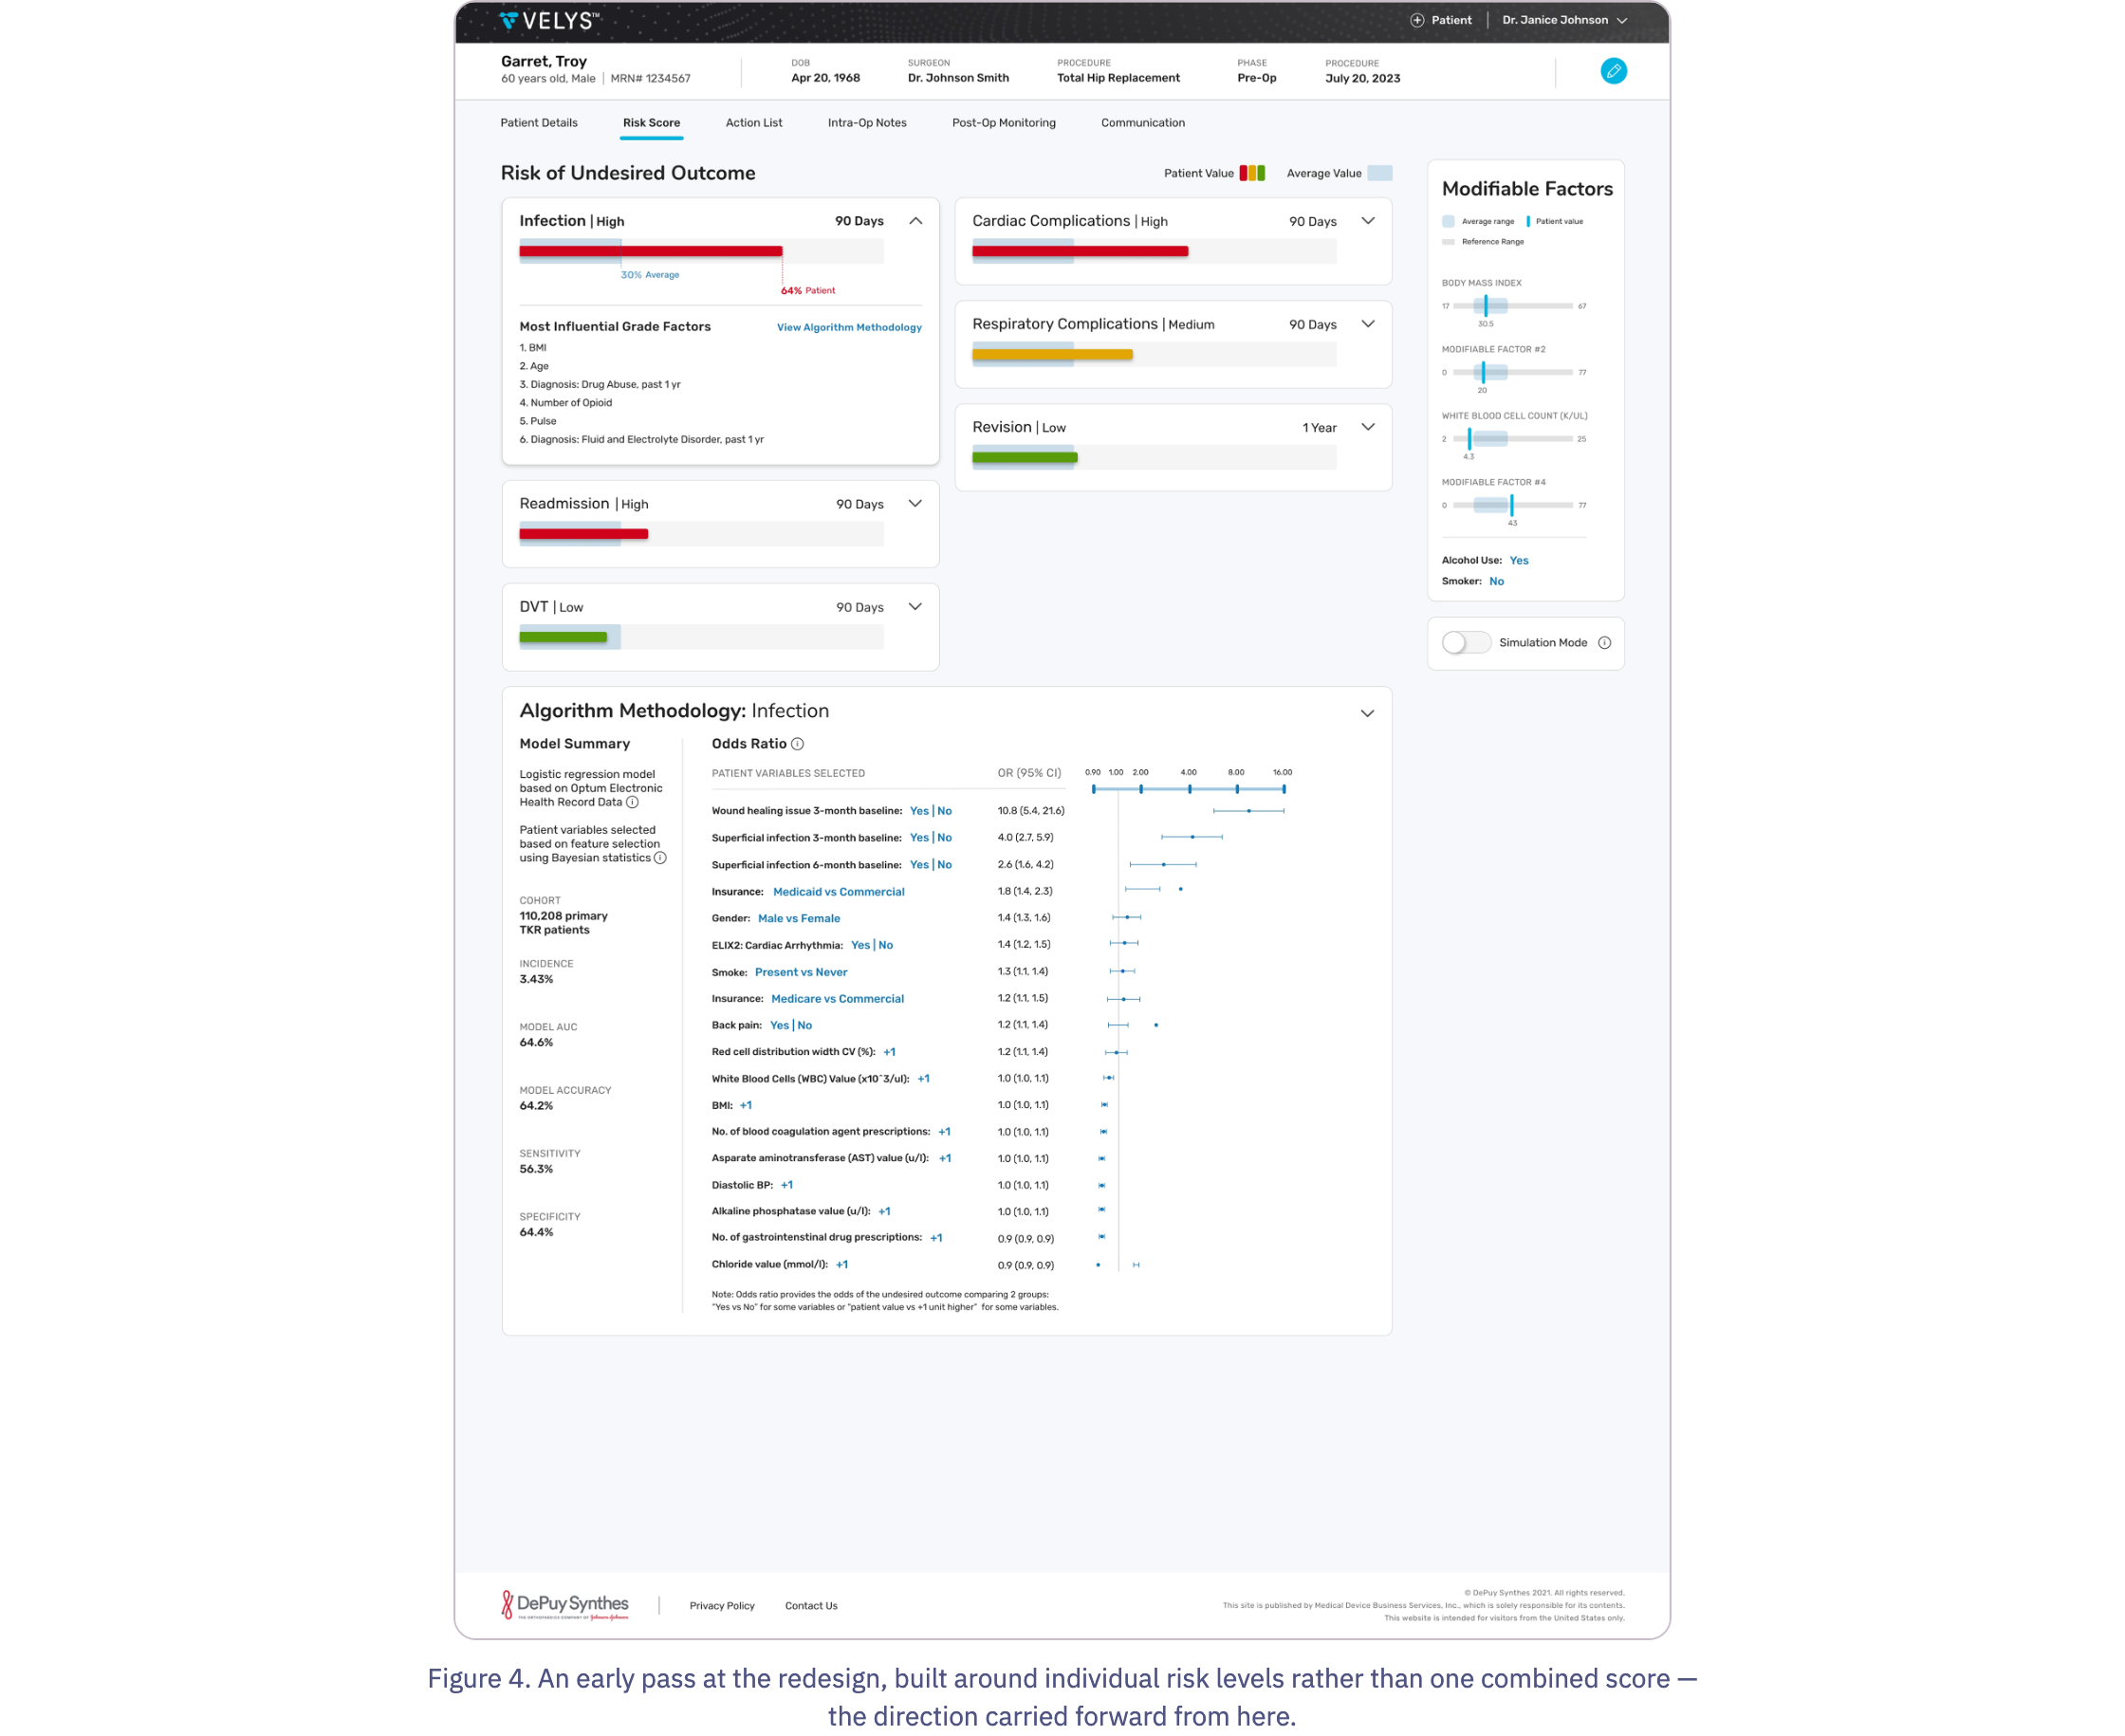
A version of this simplified direction shipped, and was shown at a subsequent surgeons’ meeting, where it was well received, per PM relay.
ADDENDUM · OCTOBER 2026
How I would redesign this today
I recently went back to the direction in Figure 4 and rebuilt it as an interactive prototype. The brief was the three surgeon points above, plus my own critique of what I’d made. Four things bothered me: the two-column layout stopped organizing by severity as soon as a card expanded; an outcome’s name and its level read as the same kind of information; the red, amber and green didn’t account for color-vision deficiency; and the Modifiable Factors panel was static unless it was in simulation mode.

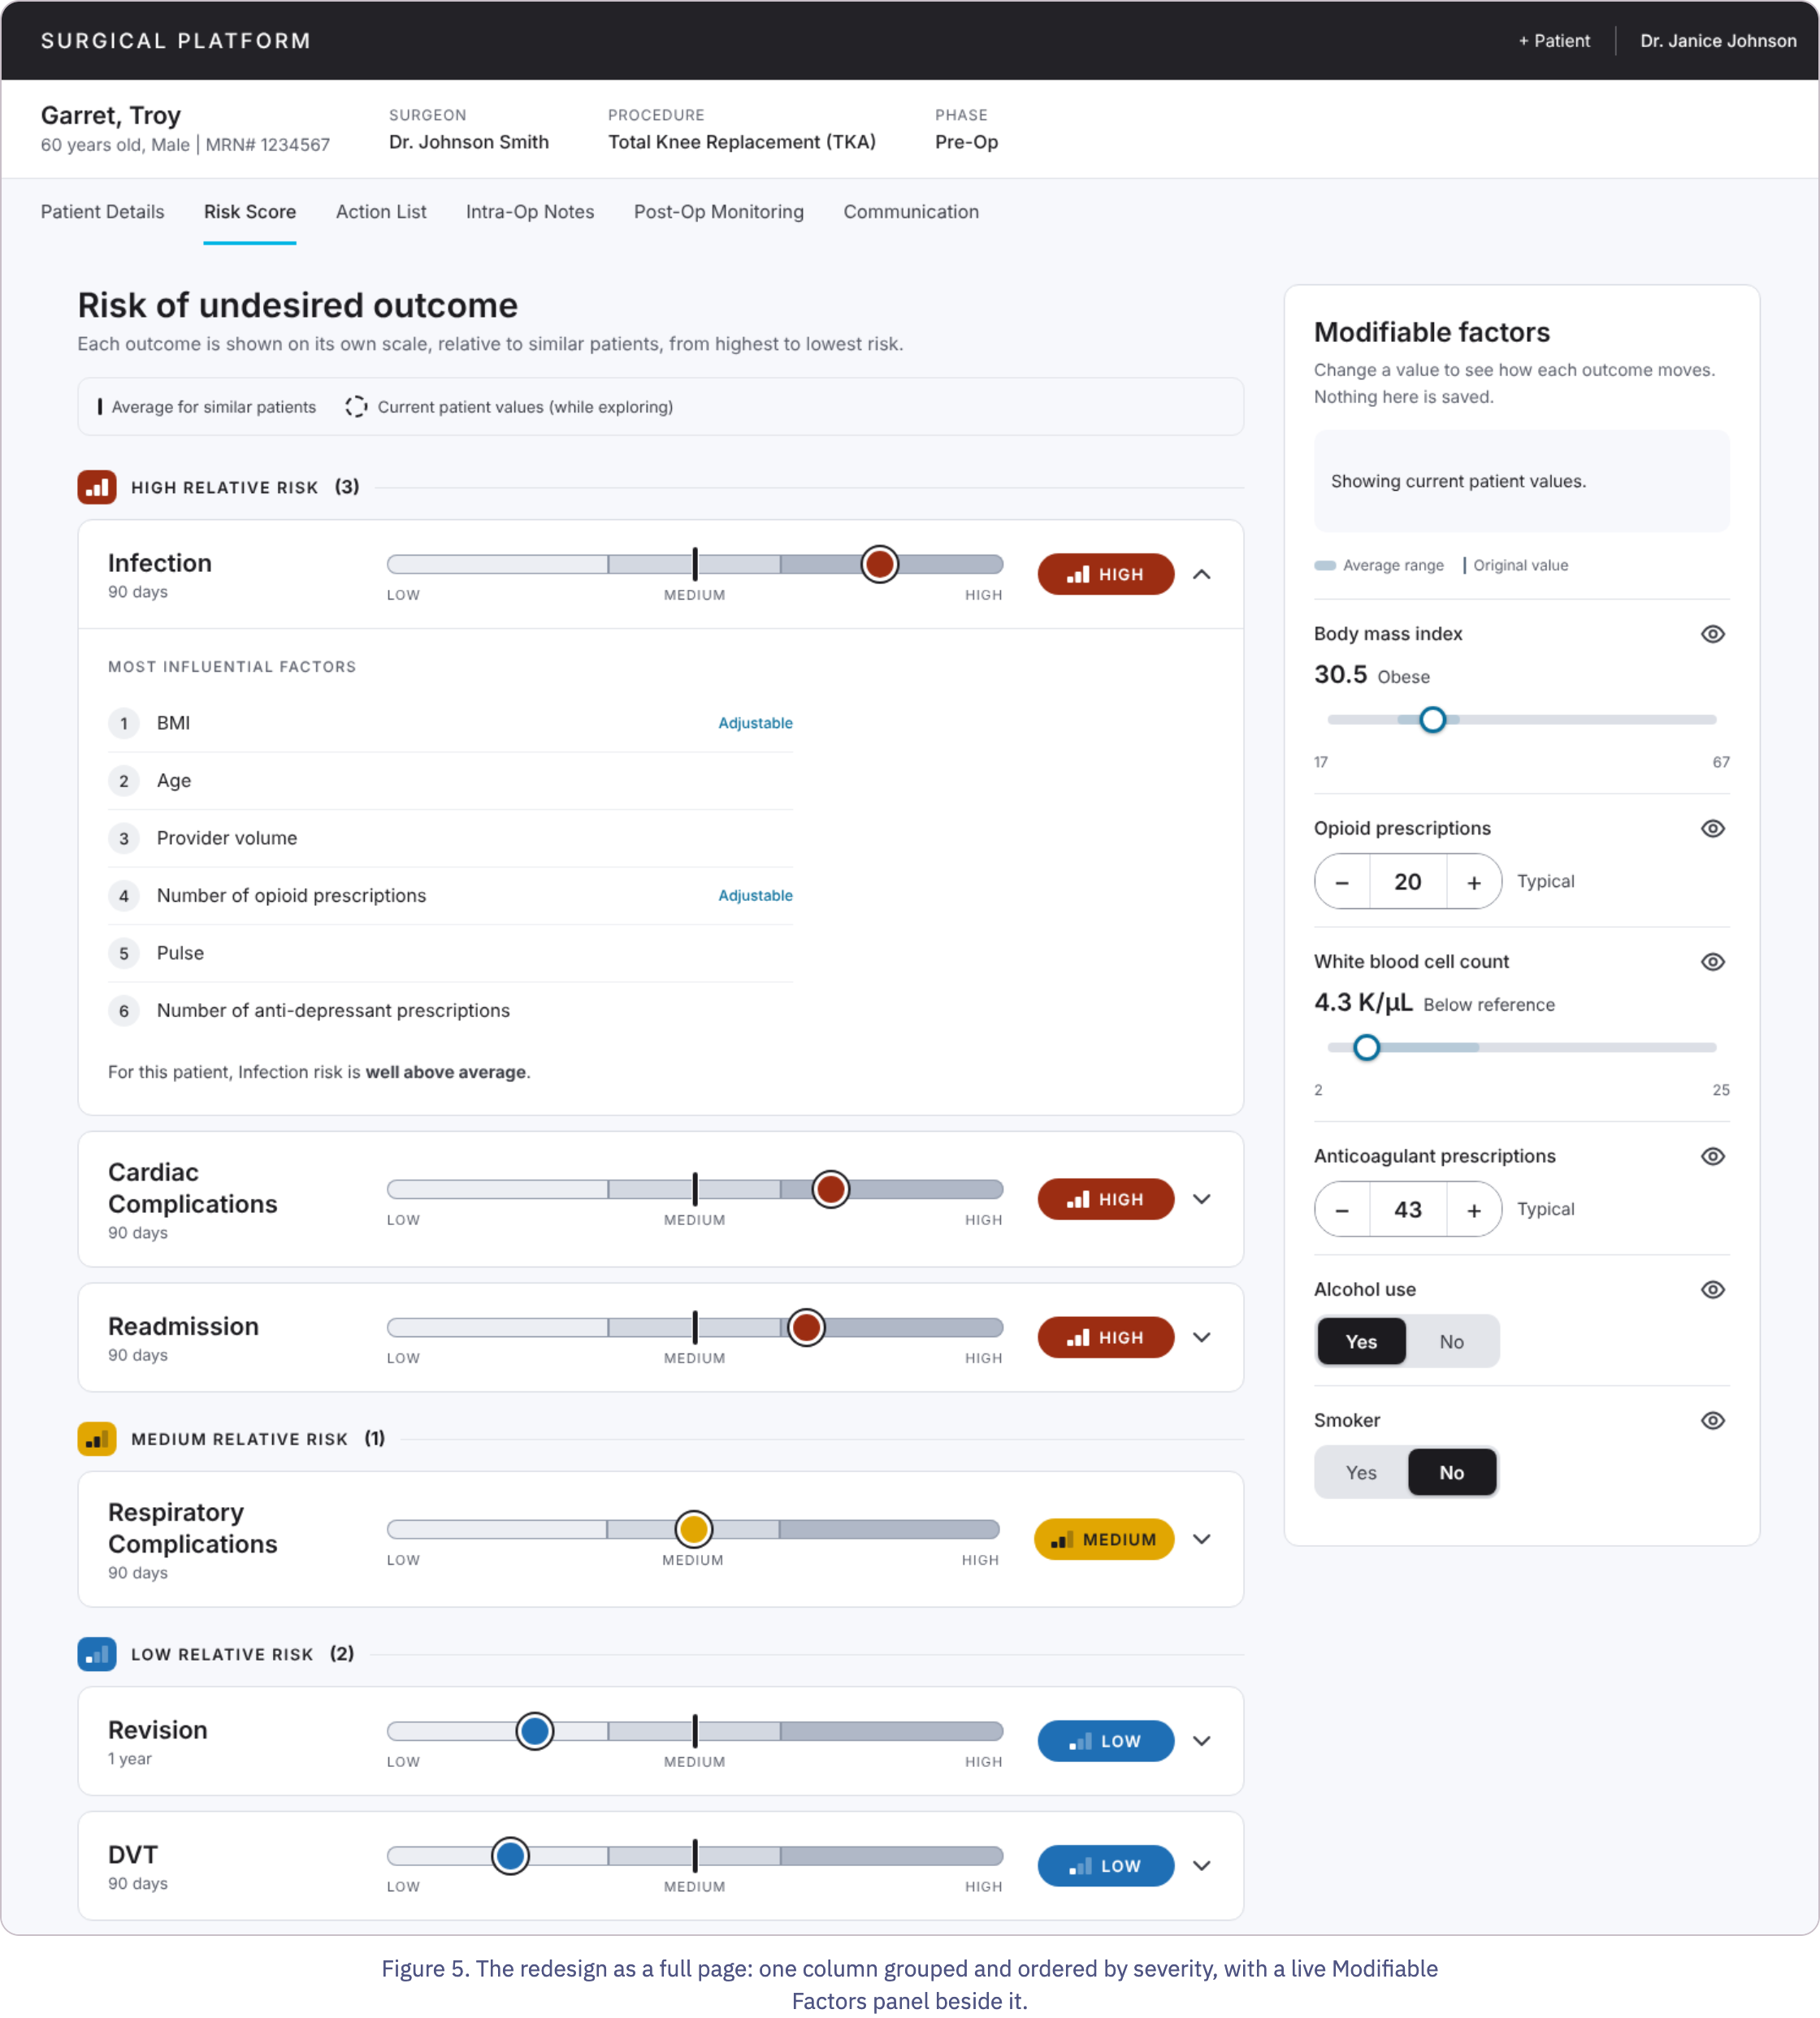


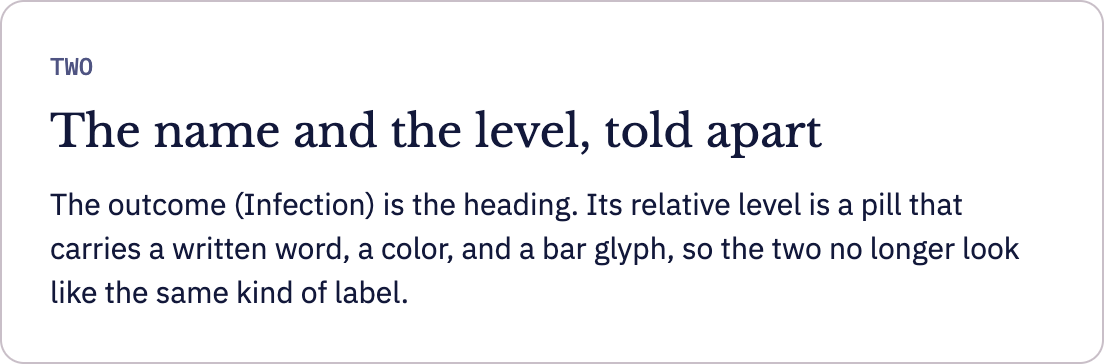
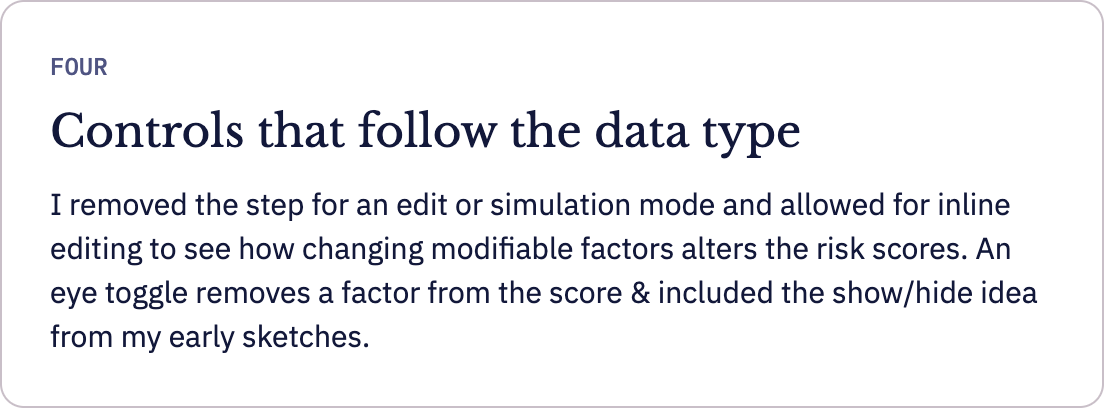
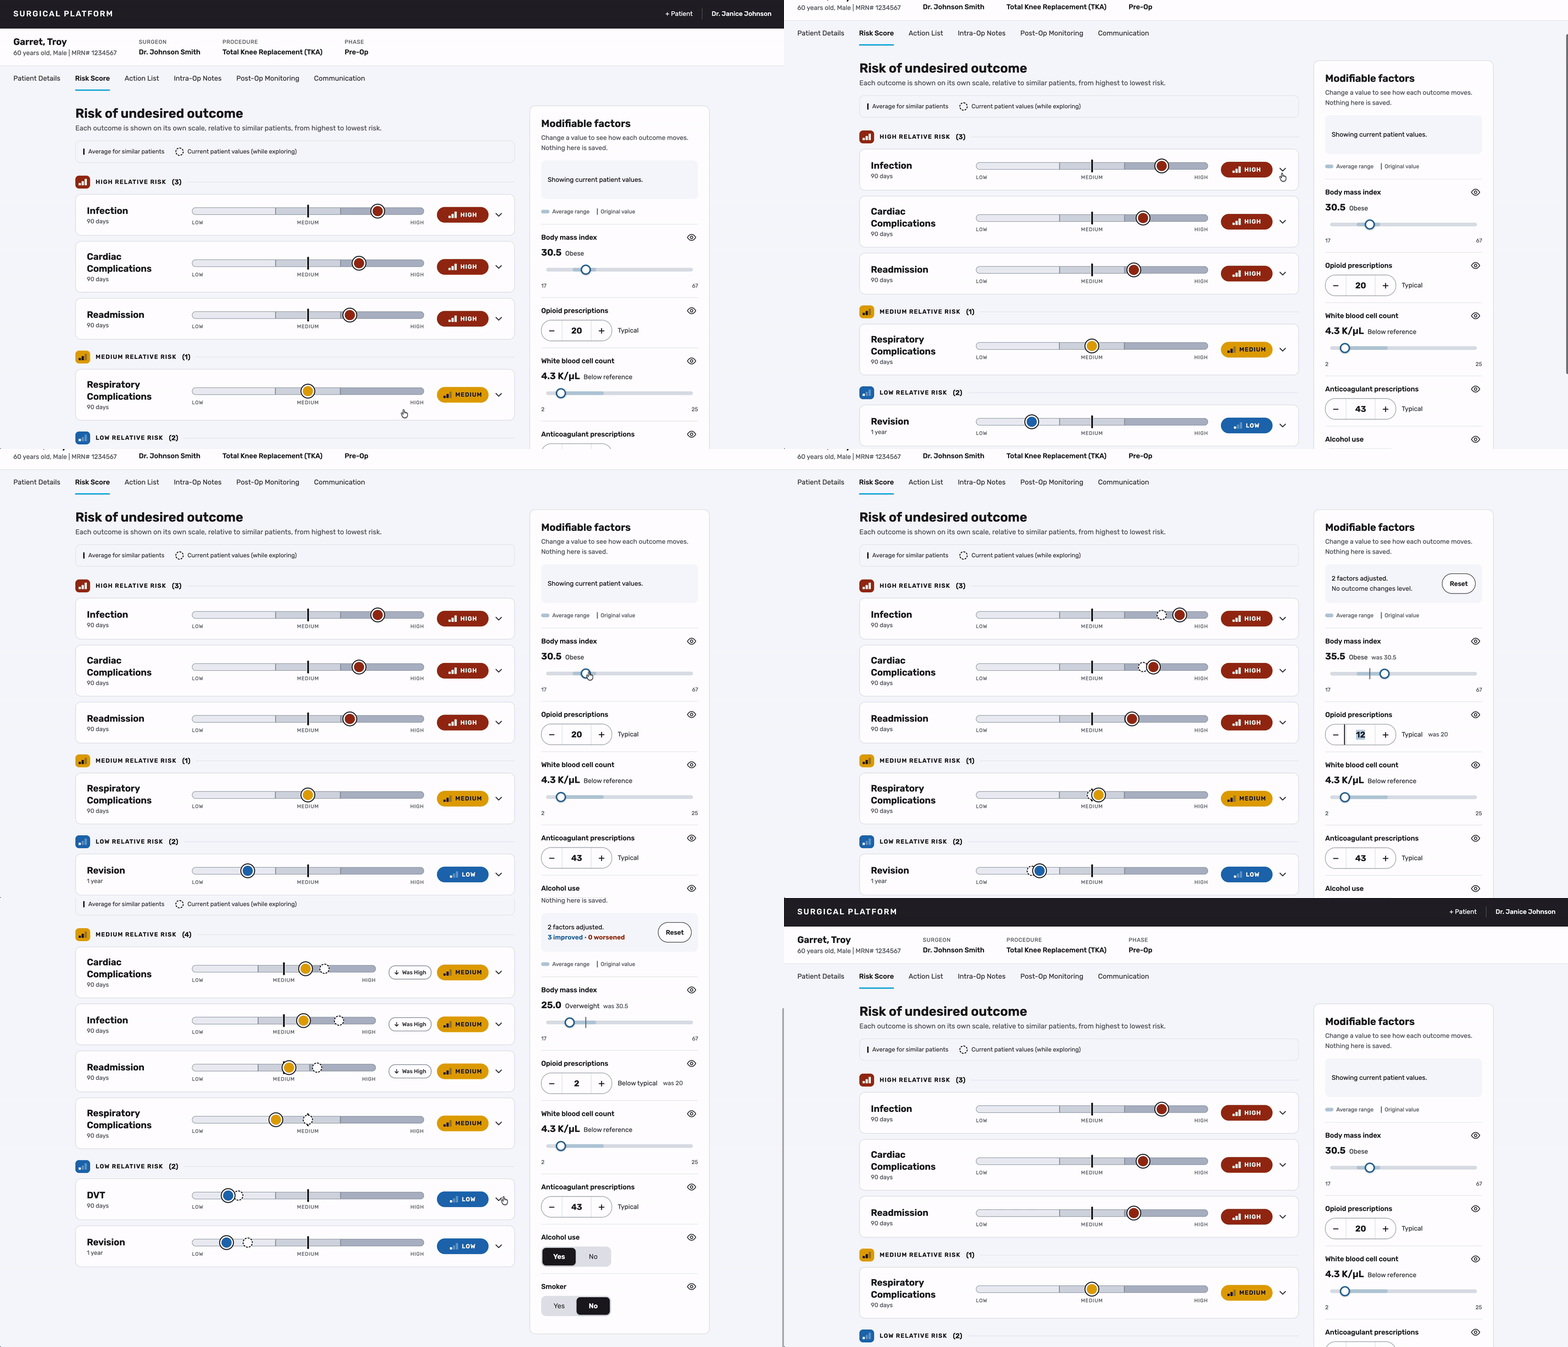
Figure 6. Recorded from the prototype: expanding cards, then adjusting BMI and opioid prescriptions. Outcomes move from High to Medium and are marked as “Was High.”
AN OPEN QUESTION
Re-sorting keeps the severity order intact, but it also moves cards while someone is mid-conversation with a patient. I don’t know whether surgeons would prefer that to a stable order with change markers. The next step would be a short moderated session with surgeons on exactly that, and a pass with participants who have color-vision deficiency.